
Introduction
40.3% of U.S. adults had obesity between 2021 and 2023, according to measured data from the National Health and Nutrition Examination Survey (NHANES). This figure exists alongside a fitness industry seeing record participation but failing to retain half of its new members. Meanwhile, only 24.2% of adults meet federal guidelines for both aerobic and muscle-strengthening activity, and the rise of GLP-1 medications is fundamentally reshaping the $135 billion weight loss market. This report compiles and analyzes data from primary sources including the CDC/NHANES, the Health & Fitness Association (HFA), IBISWorld, Gallup, Marketdata LLC, and peer-reviewed clinical trials to provide a clear picture of weight loss and personal training in 2026.
Key Takeaways
- 40.3% of U.S. adults aged 20 and over had obesity, with 72.4% classified as either overweight or having obesity (NCHS/NHANES, 2026).
- Only 24.2% of adults met the combined federal guidelines for both aerobic and muscle-strengthening activity (CDC NCHS, 2020).
- Adherence to a training program is 88.2% with a personal trainer versus just 52.2% when self-guided (JSCR, 2025).
- The U.S. personal trainer industry is an $11.9 billion market in 2026 (IBISWorld, 2025).
- 77 million Americans held a gym membership in 2024, a record high, yet 50% of new members quit within six months (HFA, 2025).
- The total U.S. weight loss market reached a peak of $135 billion in 2025 (Marketdata LLC, 2026).
- Approximately 1 in 8 U.S. adults report having taken a GLP-1 agonist medication like Ozempic or Wegovy (KFF, 2024).
- Resistance training combined with diet leads to greater fat loss and preservation of fat-free mass than diet alone (BMJ Open Sport, 2025).
- The self-reported U.S. adult obesity rate fell to 37.0% in 2025, down from a 39.9% peak in 2022 (Gallup, 2025).
1. U.S. Obesity & Overweight Landscape
The most definitive federal data shows that 40.3% of U.S. adults have obesity, a figure derived from direct physical measurements. This contrasts with Gallup’s lower 37.0% figure, which relies on self-reported height and weight—a method known to produce underestimations. The gap between measured reality and self-perception underscores the scale of the public health challenge, as more than seven in ten adults are classified as either overweight or having obesity.
| Metric | Value | Source |
|---|---|---|
| U.S. Adult Obesity (20+) | 40.3% | NCHS/NHANES, Feb 2026 |
| Overweight or Obese (20+) | 72.4% | NCHS/NHANES, Feb 2026 |
| Self-Reported Obesity Rate | 37.0% | Gallup, Oct 2025 |
| Self-Reported Trend | 39.9% (2022) → 37.0% (2025) | Gallup, Oct 2025 |
| Severe Obesity, Adults | 9.2% | Most recent available data: NCHS, 2018 |
| Obesity, Adults 40–59 | 44.3% | Most recent available data: NCHS, 2018 |
| Child/Adolescent Obesity | 19.7% | Most recent available data: NCHS, 2018 |
| Healthy People 2030 Goal | 36.0% | U.S. Dept. of Health & Human Services |
Source: CDC National Center for Health Statistics
2. The Physical Activity Gap
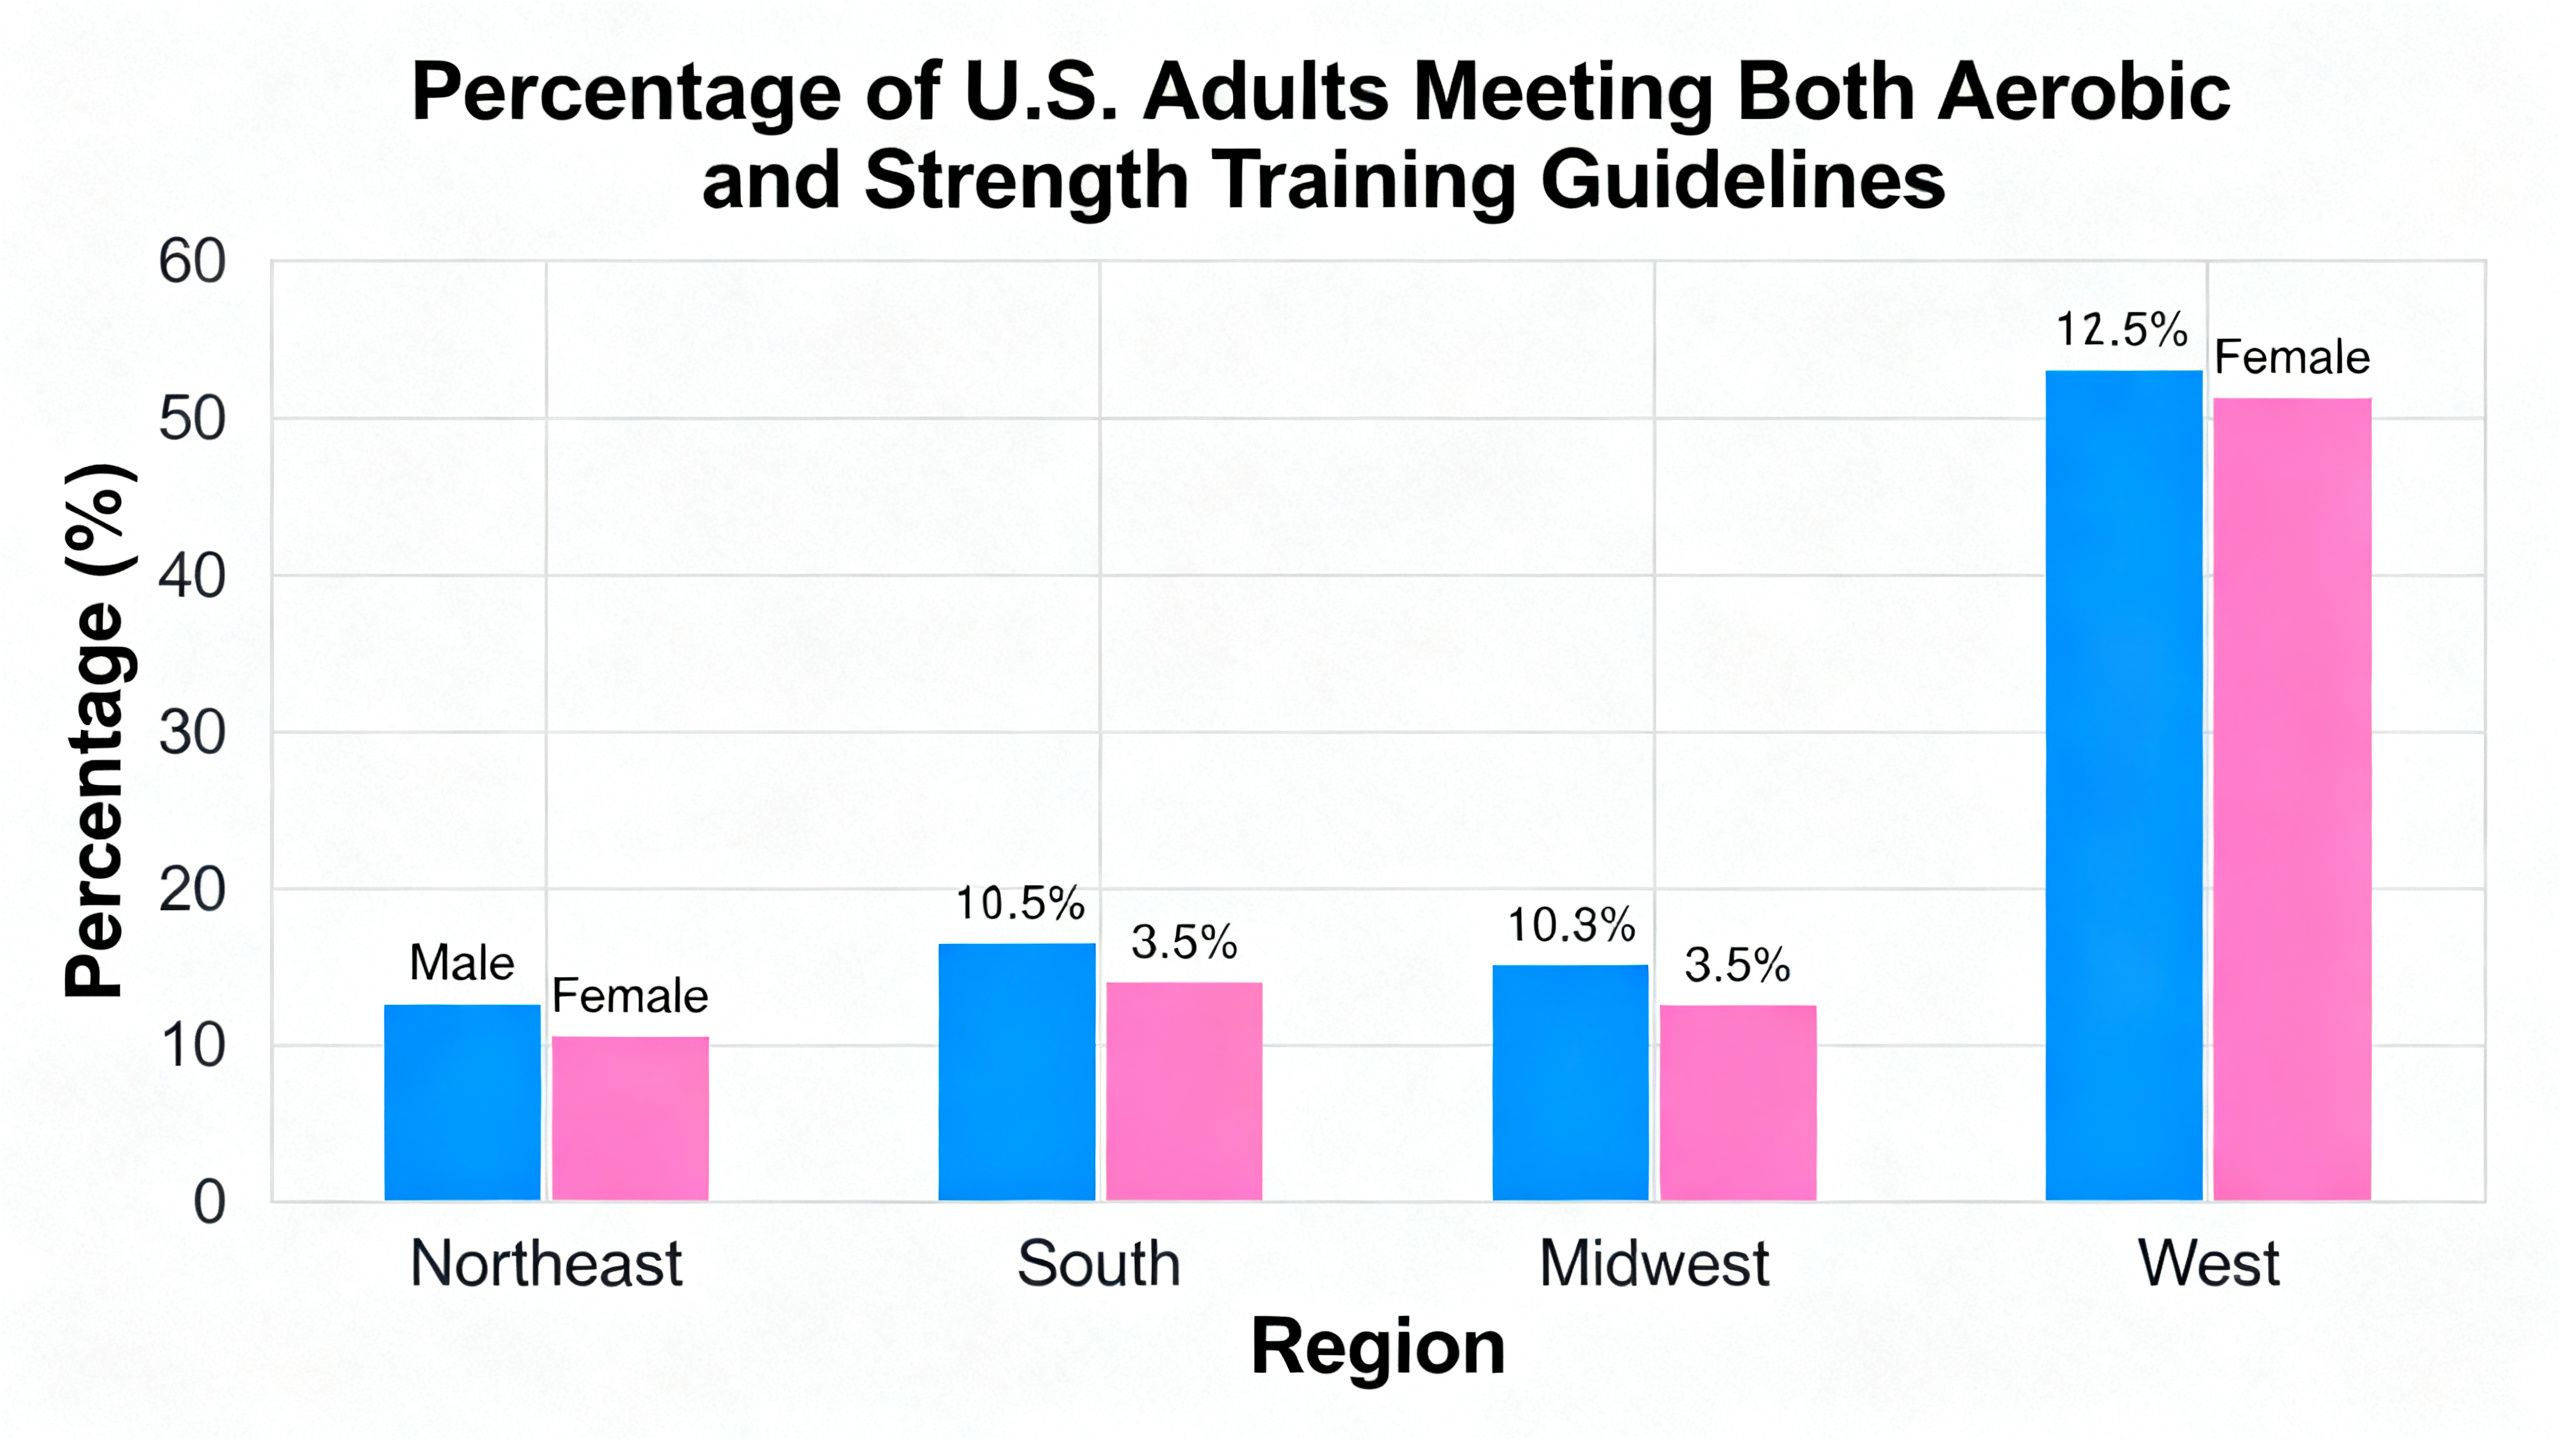
While nearly half of American adults (47.2%) meet guidelines for aerobic activity, a significant gap emerges when strength training is included. Only 24.2% of adults meet both aerobic and strength guidelines, according to the most recent available data. This highlights a critical deficiency in public fitness habits, as resistance exercise is essential for building and maintaining muscle mass, which is vital for metabolic health and long-term fat loss. This is the specific gap that structured coaching and personal training are designed to close.
| Metric | Value | Source |
|---|---|---|
| Met Aerobic Guidelines | 47.2% | CDC NCHS, April 2026 |
| Met Aerobic & Strength Guidelines | 24.2% | Most recent available data: CDC NCHS, 2020 |
| Met Both Guidelines (Men) | 28.3% | Most recent available data: CDC NCHS, 2020 |
| Met Both Guidelines (Women) | 20.4% | Most recent available data: CDC NCHS, 2020 |
| Met Both Guidelines (West U.S.) | 28.5% | Most recent available data: CDC NCHS, 2020 |
| Met Both Guidelines (South U.S.) | 21.4% | Most recent available data: CDC NCHS, 2020 |
Source: CDC NCHS Physical Activity Surveillance
3. The Fat Loss Research Reality
Effective weight management prioritizes fat loss while preserving metabolically crucial muscle tissue. Research consistently demonstrates that resistance training (RT) is superior for achieving this outcome. While aerobic training can reduce total weight, it often does so at the expense of fat-free mass. In contrast, combining a proper diet with RT maximizes fat loss and helps maintain or even build muscle, improving body composition and long-term metabolic rate. This focus on the quality of weight lost is a cornerstone of effective nutrition coaching.
| Metric | Finding | Source |
|---|---|---|
| Diet + RT vs. Diet-Only | Greater fat loss and FFM preservation with RT | BMJ Open Sport, 2025 |
| AT vs. RT (Fat Mass) | Both reduce fat mass effectively | PMC, 2025 (n=1,564) |
| AT vs. RT (Fat-Free Mass) | RT preserves/increases FFM; AT can decrease FFM | PMC, 2025 (n=1,564) |
| Body Recomposition | RT group gained 1.2 kg FFM while losing 1.7 kg fat | Frontiers in Endocrinology, 2026 (n=304) |
| Weight Loss Quality | RT group lost 97% of weight from fat vs. 78% for AT group | J Am Coll Nutr, 2017 |
Source: PubMed Central (PMC) Database of Peer-Reviewed Literature
4. The Supervised Training Advantage
The primary driver of fitness results is adherence, and data shows that supervision is the key variable. In a 2025 study, individuals in a supervised training program demonstrated 88.2% adherence, a massive 36-point gap over the 52.2% adherence rate for a self-guided group. This accountability directly translates into superior outcomes, with research showing that only groups working with a personal trainer achieve statistically significant fat loss. This advantage is why services like semi-private personal training are so effective.
| Metric | Value | Source |
|---|---|---|
| Adherence (Supervised Training) | 88.2% | Gavanda et al., JSCR, 2025 (n=79) |
| Adherence (Self-Guided) | 52.2% | Gavanda et al., JSCR, 2025 (n=79) |
| Significant Fat Loss | Only PT group achieved it (-1.61 kg, p=0.033) | ScienceDirect, 2024 |
| Strength Gains | Significantly greater in PT group vs. self-guided | Multiple Studies |
| Gym Members Using a PT | 22.6% (Record High) | HFA 2025 Consumer Report |
| Growth in PT Use (Women) | +15.9% | HFA 2025 Consumer Report |
Source: Journal of Strength and Conditioning Research
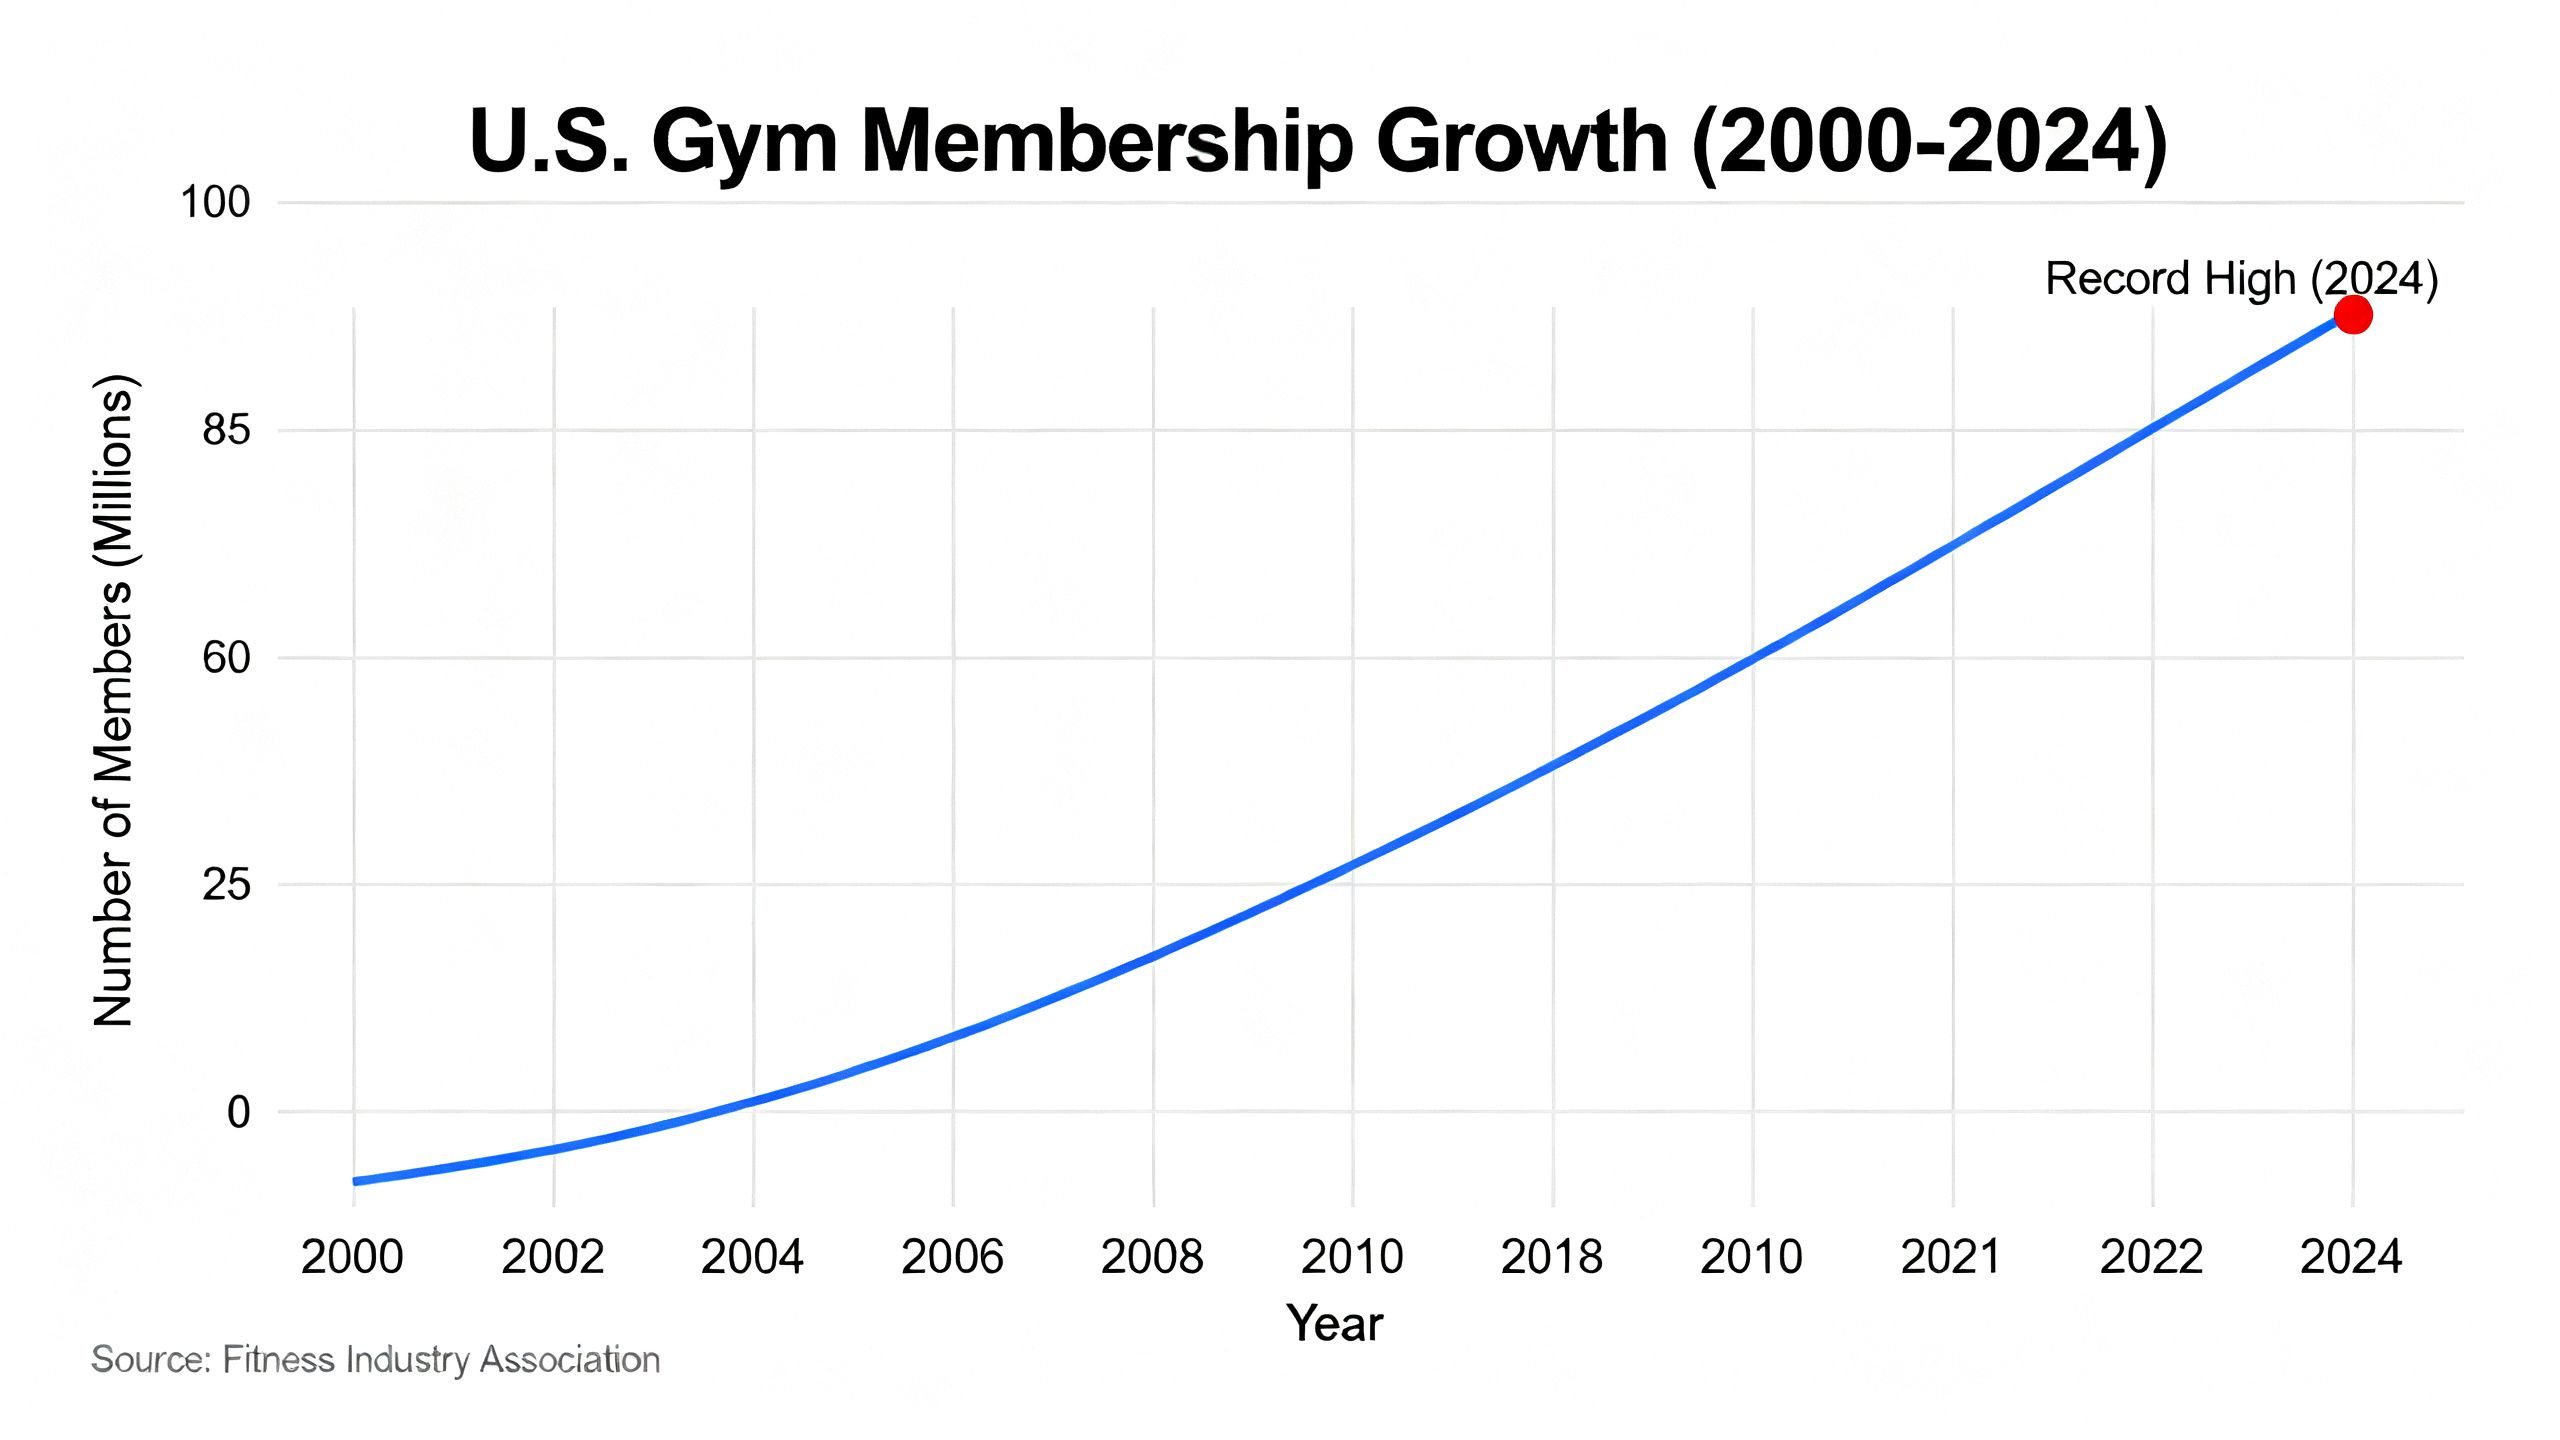
5. Gym Membership & Fitness Participation
The U.S. fitness industry reached a milestone with 77 million gym members in 2024. However, this all-time high is shadowed by a persistent retention crisis. 50% of new gym members quit within the first 6 months, a statistic that has remained a stubborn benchmark for the industry. This indicates a fundamental disconnect between providing access to facilities and providing the support needed for long-term adherence. Data shows that a structured onboarding process can dramatically improve retention, with 87% of well-onboarded members staying past the six-month mark.
| Metric | Value | Source |
|---|---|---|
| Total U.S. Gym Members (2024) | 77 Million | HFA, 2025 |
| U.S. Population Penetration | 24.9% | HFA, 2025 |
| New Member Dropout (6 Months) | 50% | HFA/IHRSA Benchmark |
| Retention (Well-Onboarded) | 87% stay 6+ months | HFA, 2025 |
| Members Using Personal Training | 22.6% | HFA, 2025 |
| Members Using Small Group Training | 32.3% | HFA, 2025 |
| Average Monthly Fee | $69 | HFA, 2025 |
| Average Annual Visits/Member | 21 (down from 28 in 2019) | HFA, 2025 |
Source: Health & Fitness Association 2025 Consumer Report
6. The Weight Loss Industry by the Numbers
The U.S. weight loss market is a behemoth, peaking at $135 billion in 2025 according to Marketdata LLC. However, this top-line number conceals a major shift. The market for commercial weight loss services is contracting (a -5.5% compound annual growth rate), largely due to the rise of medical weight loss solutions. In contrast, adjacent markets like personal training are thriving, with the U.S. market hitting $11.9 billion in 2026. This reflects a consumer pivot towards sustainable, activity-based fitness programs over traditional diet-centric models.
| Metric | Value | Source |
|---|---|---|
| Total U.S. Weight Loss Market | $135 Billion (2025) | Marketdata LLC, March 2026 |
| U.S. Personal Trainer Market | $11.9 Billion (2026) | IBISWorld, July 2025 |
| U.S. Weight Loss Services CAGR | -5.5% | IBISWorld, July 2025 |
| Global Weight Management Market | $176.67 Billion (2025) | Grand View Research, 2025 |
| Global Personal Training Market | $43.3 Billion (by 2036) | Future Market Insights |
Note: Market size estimates vary by research firm due to differences in methodology and scope (e.g., inclusion of supplements, medical procedures, or digital apps).
Source: IBISWorld Personal Trainers in the US Industry Report
7. GLP-1 Medications & The Fitness Response
The rapid adoption of GLP-1 medications is a primary factor in the recent decline in self-reported obesity, which fell from 39.9% in 2022 to 37.0% in 2025. With roughly 1 in 8 U.S. adults having used these drugs, their impact is undeniable. However, research from the STEP clinical trials and other studies shows that the resulting weight loss can include a significant reduction in lean muscle mass. This makes resistance training a critical partner to pharmacotherapy, necessary to preserve metabolic function and improve the quality of the weight loss. This new reality makes professional guidance, including understanding how to use HSA/FSA for personal training, more relevant than ever.
| Metric | Value | Source |
|---|---|---|
| Self-Reported Obesity Rate | 39.9% (2022) → 37.0% (2025) | Gallup, 2025 |
| U.S. Adults Who Have Used GLP-1s | ~1 in 8 | KFF Health Tracking Poll, 2024 |
| Lean Mass Loss Risk | High without concurrent resistance training | Frontiers in CDH, 2025 |
| Additive Benefits | GLP-1s + exercise yield superior outcomes | Frontiers in CDH, 2025 |
| Average Weight Loss (STEP 1) | ~15% over 68 weeks | NEJM, 2021 |
| New Gym Revenue Opportunity | $6.8 Billion | Reach3 Insights |
Source: Frontiers in Clinical Diabetes and Healthcare
weight loss by the Numbers: Summary
| Metric | Value | Source |
|---|---|---|
| U.S. Adult Obesity Rate | 40.3% | NCHS/NHANES, 2026 |
| Adults Meeting All Activity Guidelines | 24.2% | CDC NCHS, 2020 |
| Supervised Training Adherence | 88.2% | JSCR, 2025 |
| Self-Guided Training Adherence | 52.2% | JSCR, 2025 |
| Total U.S. Weight Loss Market | $135 Billion | Marketdata LLC, 2026 |
| U.S. Personal Trainer Market | $11.9 Billion | IBISWorld, 2025 |
| U.S. Gym Members | 77 Million | HFA, 2025 |
| New Gym Member 6-Month Dropout | 50% | HFA/IHRSA Benchmark |
| Adults Who Have Used GLP-1s | ~1 in 8 | KFF, 2024 |
| Self-Reported Obesity Trend | 39.9% (2022) → 37.0% (2025) | Gallup, 2025 |
| Overweight or Obese Adults | 72.4% | NCHS/NHANES, 2026 |
| Members Using a Personal Trainer | 22.6% | HFA, 2025 |
| Fat Loss in PT Group | -1.61 kg (p=0.033) | ScienceDirect, 2024 |
| Weight Loss Services CAGR | -5.5% | IBISWorld, 2025 |
| Adults Meeting Aerobic Guidelines | 47.2% | CDC NCHS, 2026 |
Methodology and Sources
This report compiles statistics from Tier 1 and Tier 2 sources. All claims are cited in-line and listed below. We do not cite secondary blog posts or marketing materials in place of primary research.
- BMJ Open Sport & Exercise Medicine (2025)
- Centers for Disease Control and Prevention (CDC), National Center for Health Statistics (NCHS) (2020, 2026)
- Frontiers in Clinical Diabetes and Healthcare (2025)
- Frontiers in Endocrinology (2026)
- Future Market Insights (FMI)
- Gallup (State of Health and Well-Being Series, 2025)
- Grand View Research
- Health & Fitness Association (HFA) (2025 U.S. Health & Fitness Consumer Report)
- IBISWorld (Industry Reports, 2025)
- Journal of Strength and Conditioning Research (JSCR) (2025)
- Kaiser Family Foundation (KFF) (Health Tracking Poll, 2024)
- Marketdata LLC (The U.S. Weight Management Market, 2026)
- National Institutes of Health / PubMed Central (NIH/PMC)
- ScienceDirect (Peer-Reviewed Journals)
Note: The statistic that 24.2% of adults met both aerobic and strength guidelines is from a 2020 NHANES data release and is the most recent available for this specific combined metric as of early 2026.
Last updated: April 2026. We update this page quarterly.