

Introduction
40.3% of U.S. adults aged 20 and over had obesity between August 2021 and August 2023 (NCHS/NHANES, Feb 2026). This figure underscores a persistent public health challenge, even as the fitness and weight loss industries evolve. While only 24.2% of adults meet guidelines for both aerobic and strength activity, the personal training sector is projected to reach $11.9 billion in 2026. The landscape is further shifting with the rise of GLP-1 medications, now used by approximately 1 in 8 U.S. adults. This report compiles the definitive statistics from primary sources including CDC/NHANES, the Health & Fitness Association (HFA), IBISWorld, Gallup, Marketdata LLC, and peer-reviewed clinical trials.
Key Takeaways
- 40.3% of U.S. adults (20+) had obesity from 2021–2023, with 72.4% classified as overweight or having obesity (NCHS/NHANES, 2026).
- 37.0% of U.S. adults self-reported having obesity in 2025, a decrease from a peak of 39.9% in 2022 (Gallup, 2025).
- 24.2% of adults met federal guidelines for both aerobic and muscle-strengthening activity (CDC NCHS, 2020, most recent available).
- 88.2% of individuals in a supervised training program adhered to the regimen, compared to just 52.2% of those self-guided (Gavanda et al., JSCR, 2025).
- 77 million Americans held gym memberships in 2024, a record high, yet 50% of new members quit within six months (HFA, 2025).
- 22.6% of gym members reported using a personal trainer in 2024, also a record high (HFA, 2025).
- -1.61 kg was the statistically significant fat reduction (p=0.033) achieved only by the personal trainer group in a 2024 study (ScienceDirect, 2024).
- $135 billion is the projected value of the total U.S. weight loss market in 2025 (Marketdata LLC, 2026).
- $11.9 billion is the projected size of the U.S. personal trainer industry in 2026 (IBISWorld, 2025).
- 1 in 8 U.S. adults report having ever taken a GLP-1 agonist medication like Ozempic or Wegovy (KFF Health Tracking Poll, 2024).
1. U.S. Obesity & Overweight Landscape
The gap between measured and self-reported data highlights a key challenge in public health reporting. The CDC’s direct-measurement NHANES survey found 40.3% of adults had obesity, while Gallup’s self-reported phone survey found a lower rate of 37.0%. This discrepancy is largely attributed to underreporting of weight and overreporting of height in survey-based methods, making NHANES the clinical benchmark.
| Metric | Value | Source |
|---|---|---|
| Adult Obesity Rate (20+) | 40.3% | NCHS/NHANES, Feb 2026 |
| Adult Severe Obesity Rate | 9.2% | NCHS/NHANES, Feb 2026 |
| Overweight or Obese Adults | 72.4% | NCHS/NHANES, Feb 2026 |
| Obesity Rate, Ages 40–59 | 44.3% | NCHS/NHANES, Feb 2026 |
| Adult Obesity Rate (Self-Reported) | 37.0% (2025) vs. 39.9% (2022) | Gallup, Oct 2025 |
| Childhood Obesity Rate (2–19) | 19.7% | NCHS/NHANES, Feb 2026 |
| Healthy People 2030 Goal | 36.0% | U.S. Dept. of Health & Human Services |
2. The Physical Activity Gap
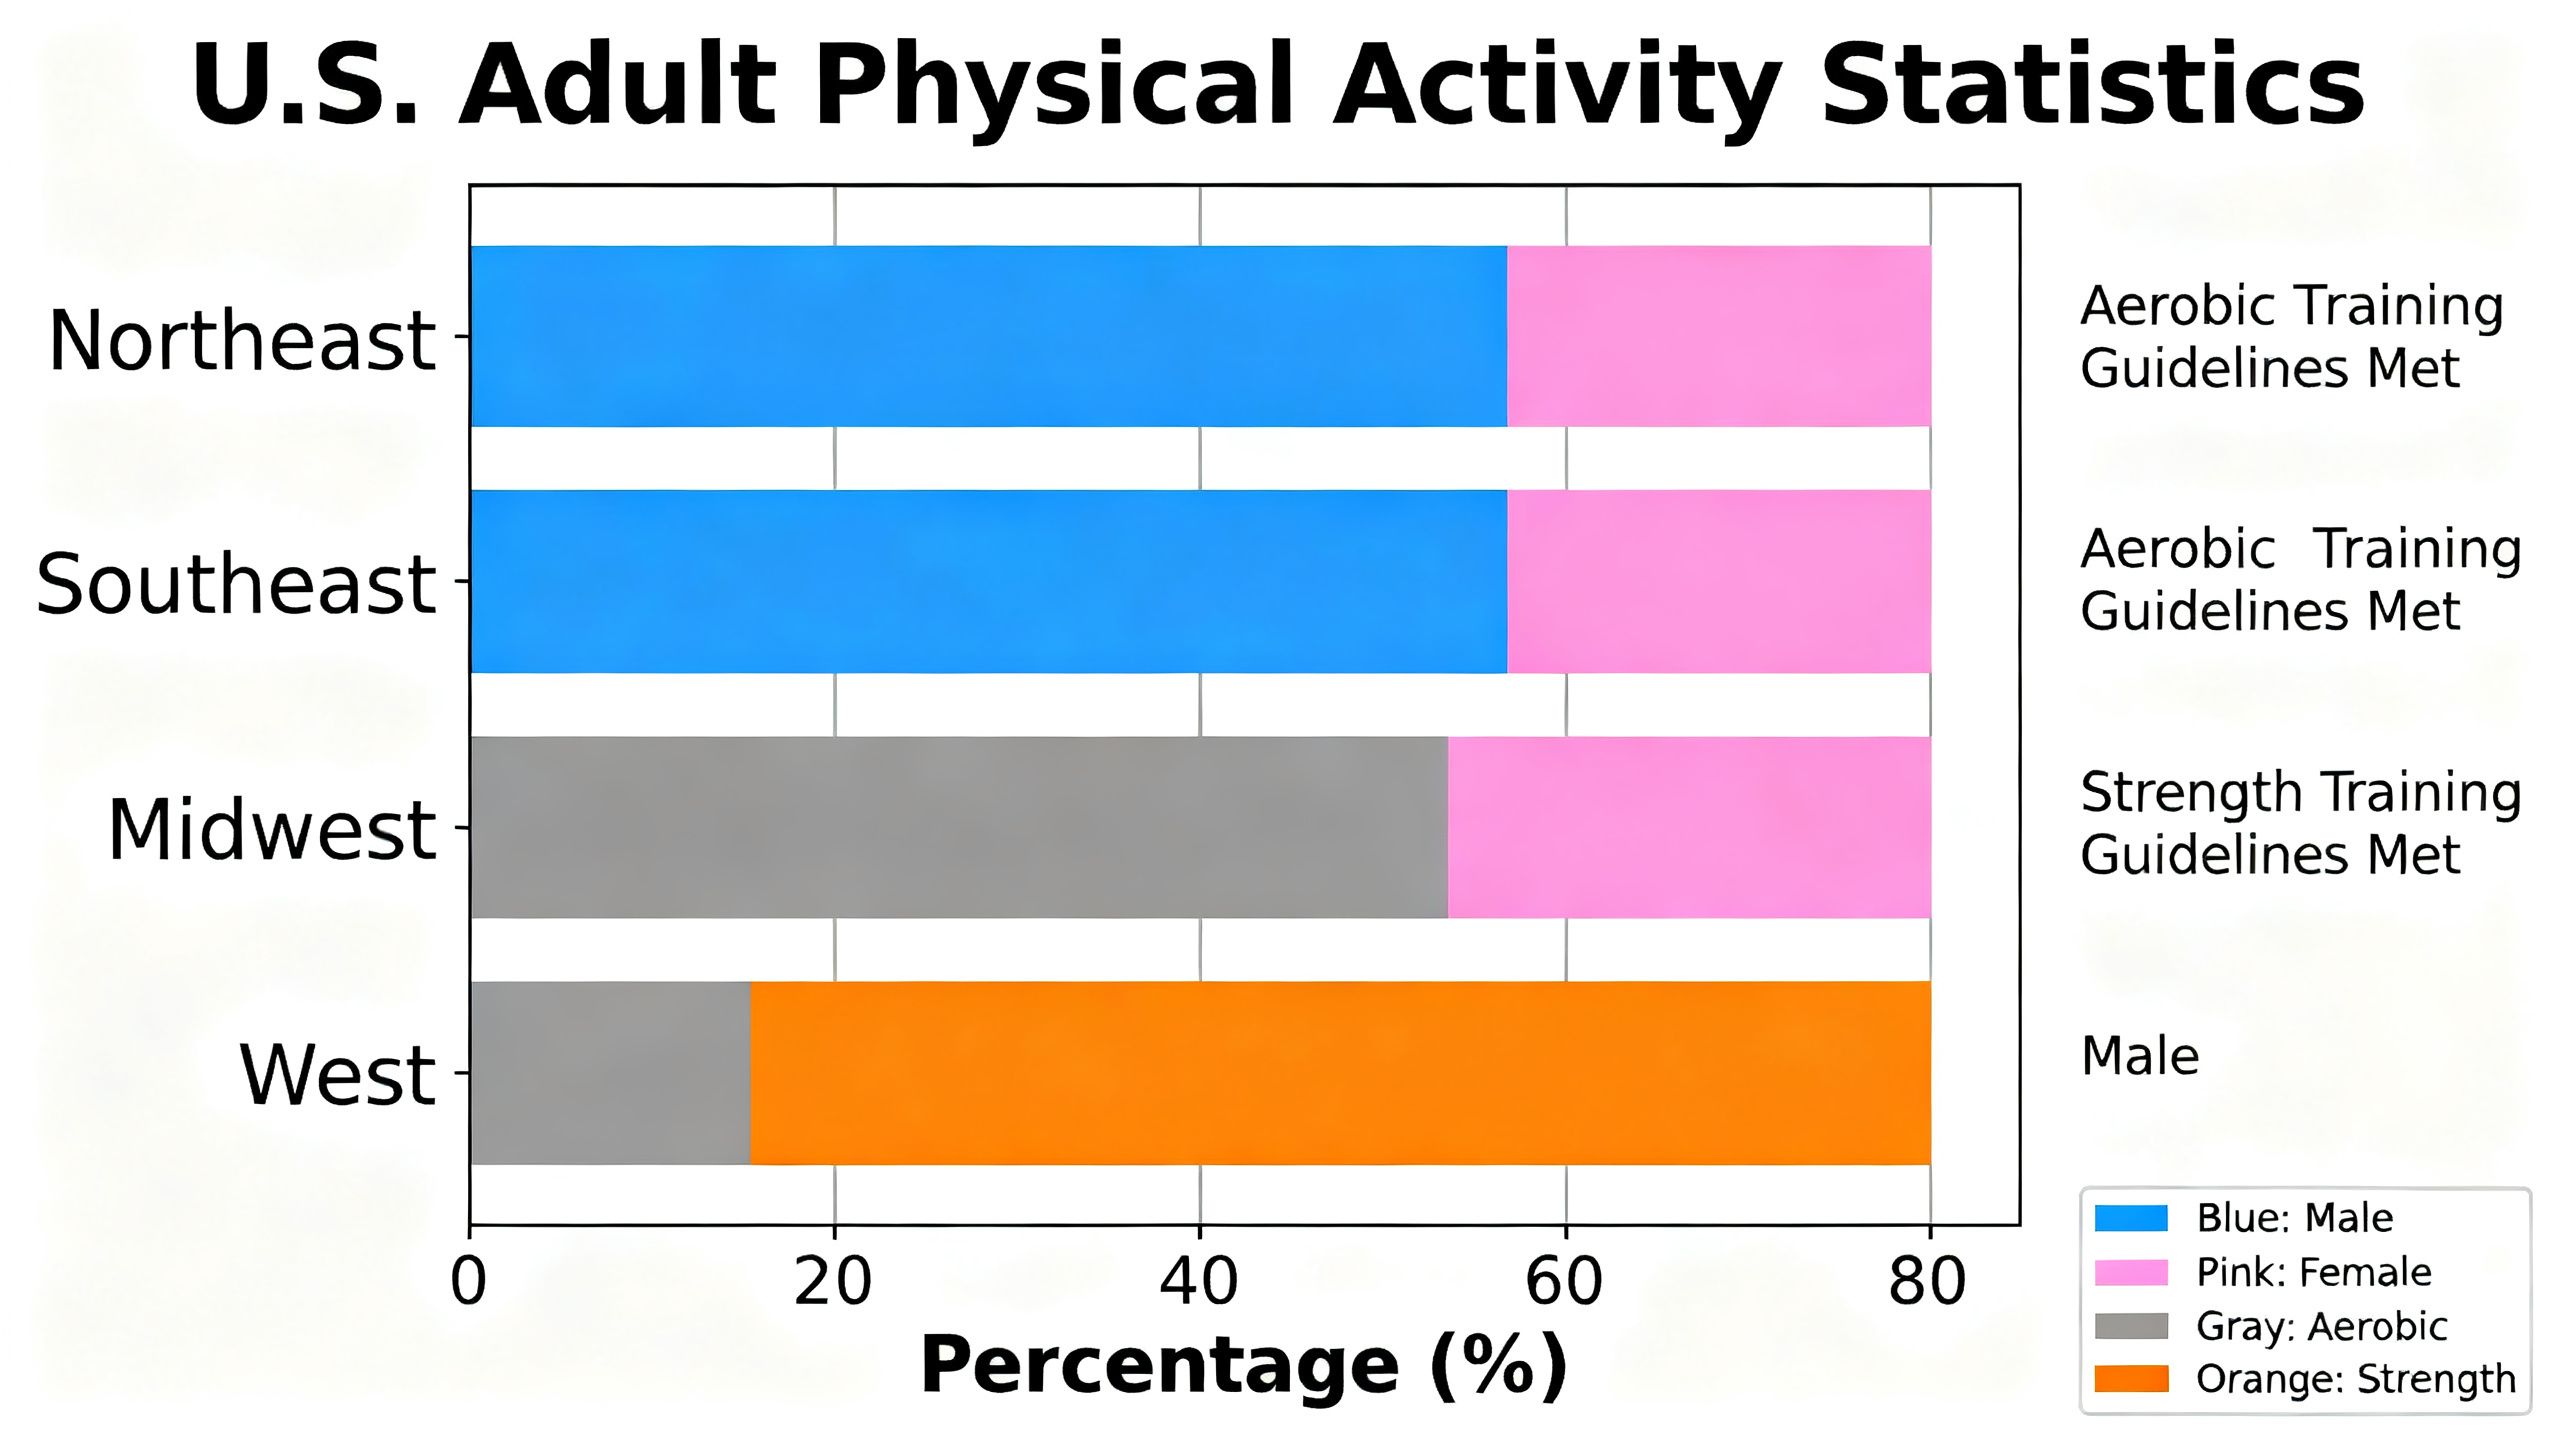
Fewer than one in four American adults meets the minimum recommended guidelines for both cardiovascular and strength training. While 47.2% achieve sufficient aerobic activity, the number plummets to 24.2% when muscle-strengthening requirements are included. This significant gap represents the primary opportunity for structured coaching to build balanced, sustainable fitness habits that individuals struggle to form on their own.
| Metric | Value | Source |
|---|---|---|
| Met Aerobic Guidelines Only | 47.2% | CDC NCHS, April 2026 |
| Met Both Aerobic & Strength | 24.2% | CDC NCHS, 2020 (Most recent available) |
| Men (Met Both Guidelines) | 28.3% | CDC NCHS, 2020 (Most recent available) |
| Women (Met Both Guidelines) | 20.4% | CDC NCHS, 2020 (Most recent available) |
| Met Both (West Region) | 28.5% | CDC NCHS, 2020 (Most recent available) |
| Met Both (South Region) | 21.4% | CDC NCHS, 2020 (Most recent available) |
Closing this gap often requires a structured approach. A 1-on-1 personal training program can provide the specific guidance needed to incorporate both strength and cardio effectively.
3. The Fat Loss Research Reality
Effective fat loss prioritizes the preservation of fat-free mass (FFM), a factor where resistance training (RT) consistently outperforms other modalities. Research shows that while aerobic training (AT) can produce weight loss, it often comes at the cost of muscle. Combining diet with RT leads to greater fat loss while maintaining or even increasing metabolically active muscle tissue, improving body composition, not just lowering the number on the scale.
| Metric | Value | Source |
|---|---|---|
| Fat Loss (Diet + RT vs. Diet Only) | -1.7 kg vs. -1.0 kg | BMJ Open Sport & Ex Med, 2025 |
| FFM Change (Diet + RT vs. Diet Only) | +0.3 kg vs. -0.8 kg | BMJ Open Sport & Ex Med, 2025 |
| Fat Mass Change (AT vs. RT) | -2.5 kg vs. -1.8 kg | PMC, 2025 (n=1,564) |
| FFM Change (AT vs. RT) | -1.1 kg vs. +0.4 kg | PMC, 2025 (n=1,564) |
| FFM Gain During Fat Loss (RT) | +1.2 kg | Frontiers in Endocrinology, 2026 (n=304) |
This research underscores the importance of integrating dietary changes with the right exercise. Expert nutrition coaching ensures your eating habits support your training goals for optimal results.
4. The Supervised Training Advantage
Accountability and expert guidance are proven drivers of results. A 2025 study found an 88.2% adherence rate for supervised training participants, a 36-point gap over the 52.2% rate for self-guided individuals. This superior adherence translates directly to better outcomes, with another study showing that only the group working with a personal trainer achieved a statistically significant reduction in body fat.
| Metric | Value | Source |
|---|---|---|
| Adherence (Supervised Training) | 88.2% | Gavanda et al., JSCR, 2025 (n=79) |
| Adherence (Self-Guided) | 52.2% | Gavanda et al., JSCR, 2025 (n=79) |
| Fat Reduction (PT Group) | -1.61 kg (p=0.033) | ScienceDirect, 2024 |
| Gym Members Using a PT (2024) | 22.6% (Record High) | HFA 2025 Consumer Report |
| Growth in PT Use by Women | +15.9% | HFA 2025 Consumer Report |
Whether you choose 1-on-1 personal training or a small group setting, professional oversight is a powerful catalyst for success.
5. Gym Membership & Fitness Participation
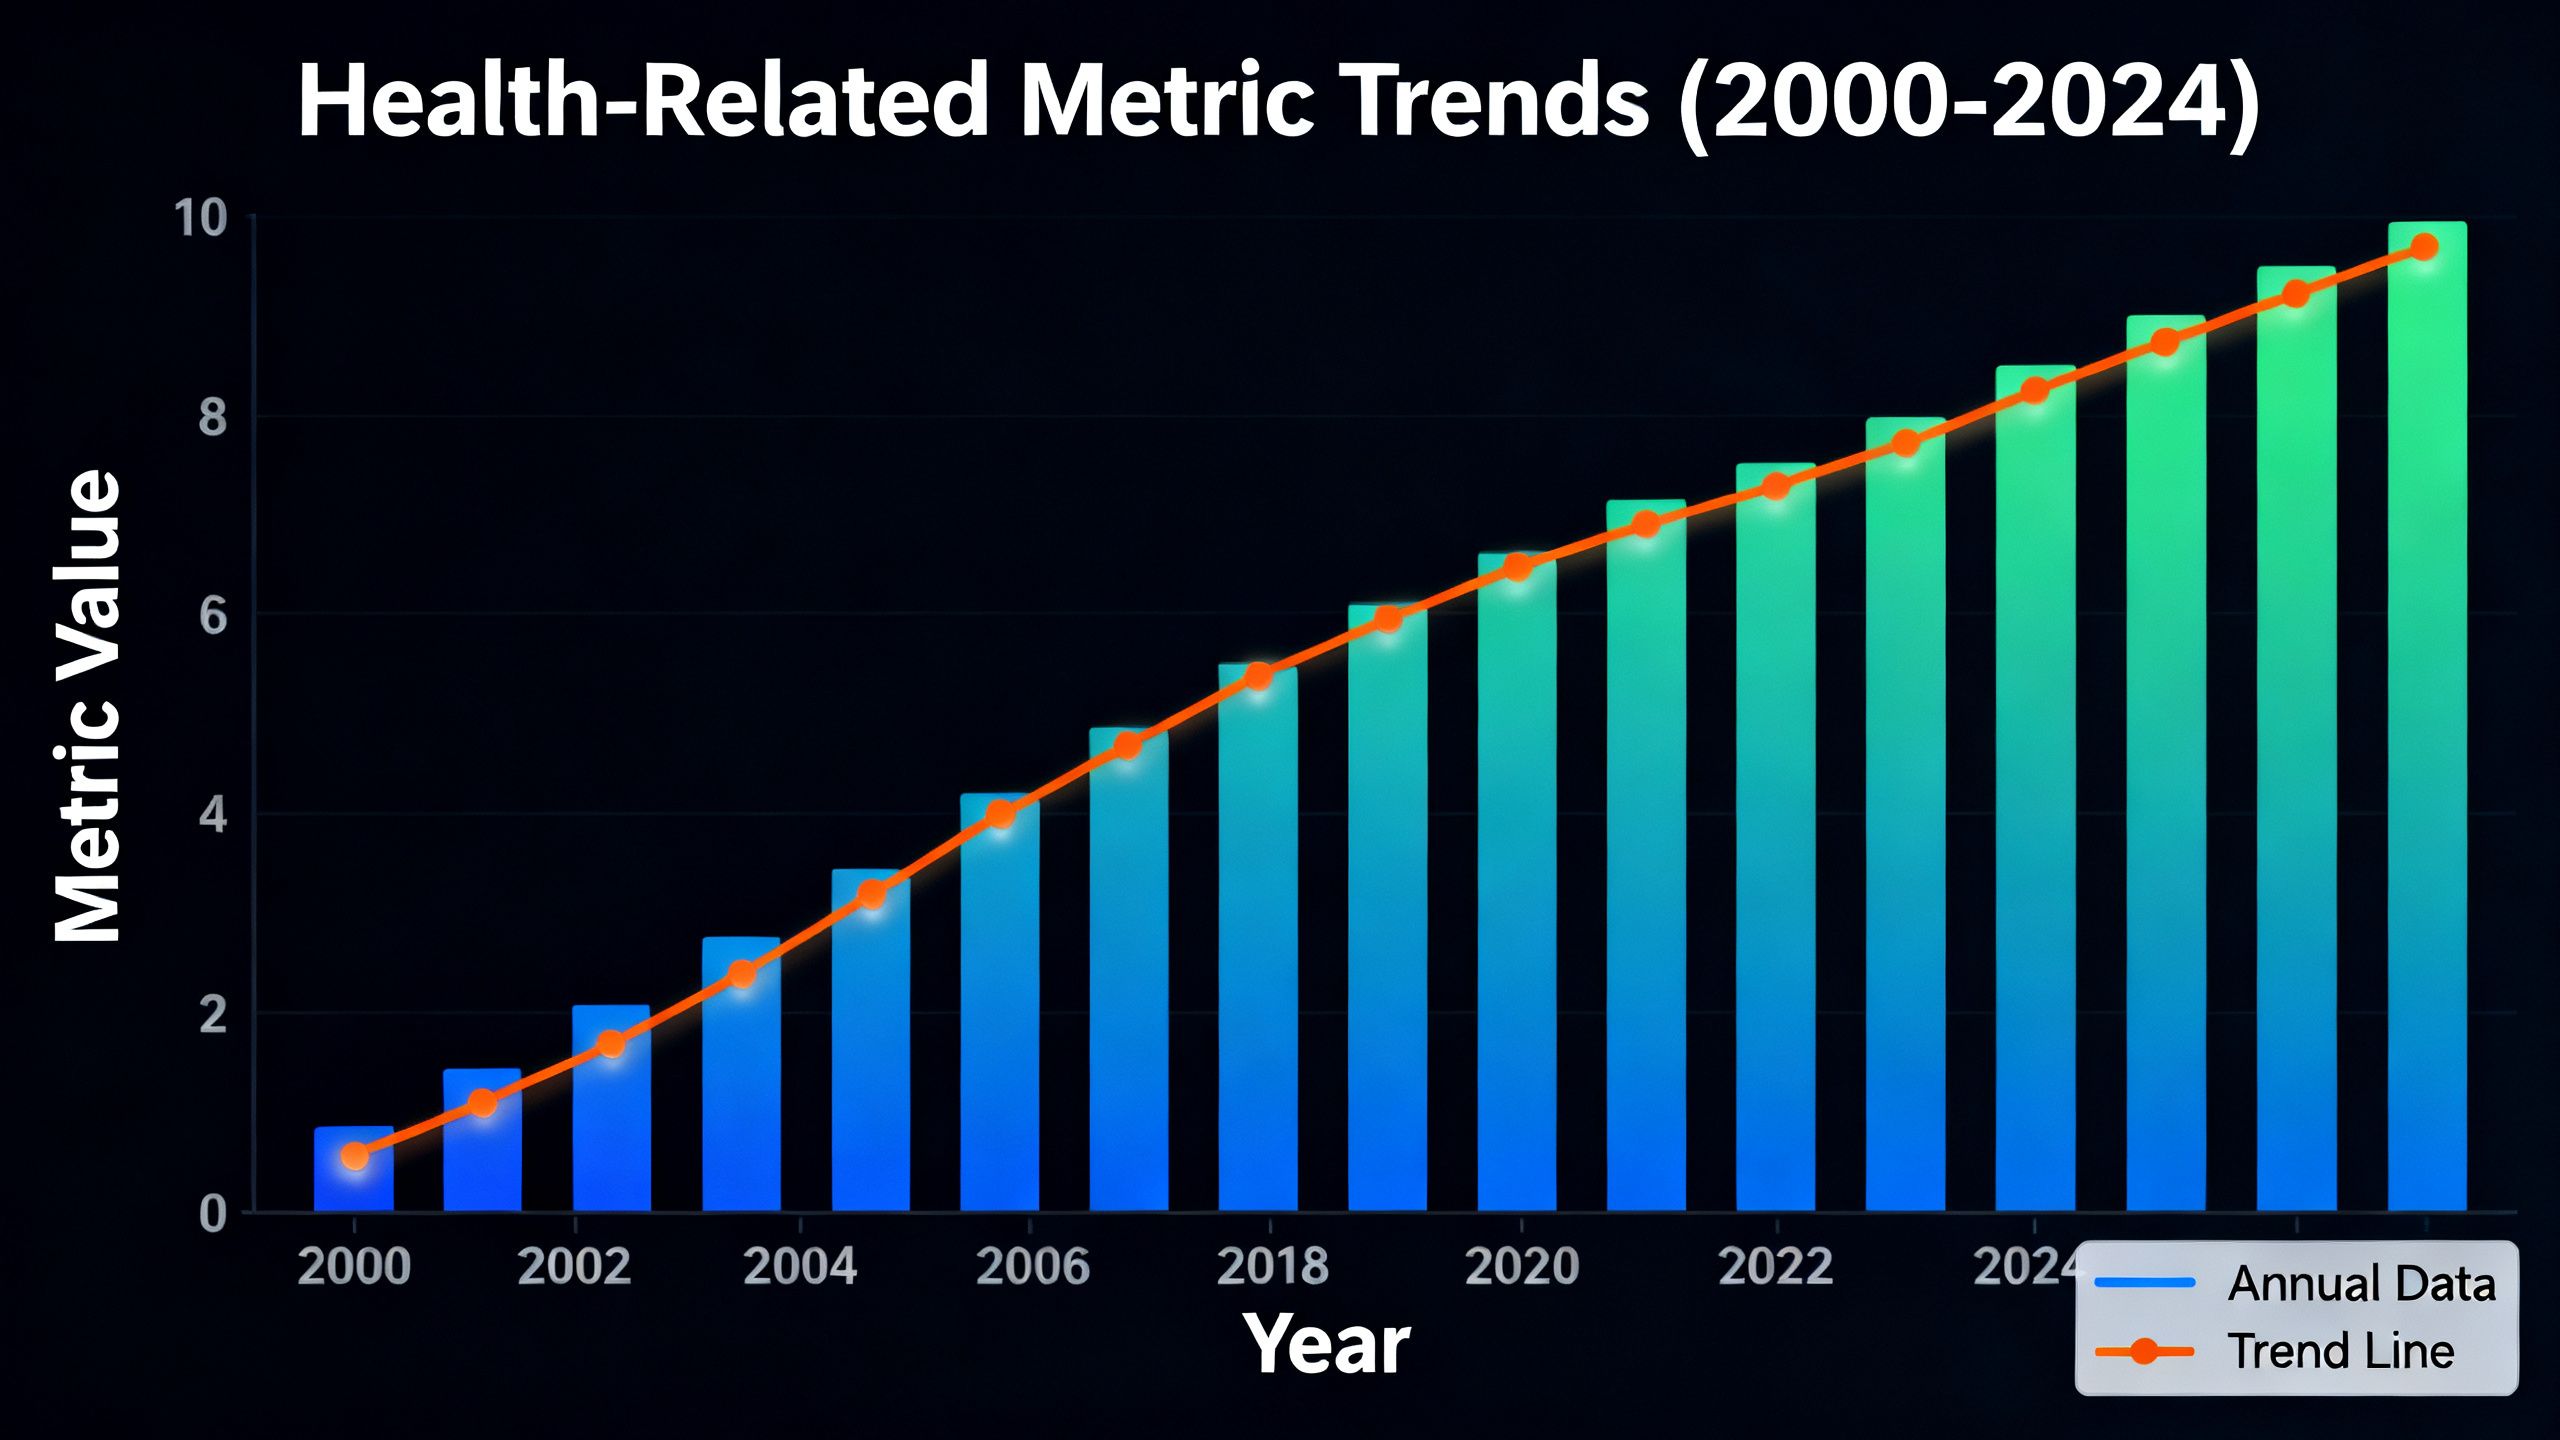
While a record 77 million Americans held a gym membership in 2024, the industry faces a persistent retention crisis. A staggering 50% of all new members quit within the first six months. However, data also shows that a positive onboarding experience is critical, with 87% of members who feel well-supported staying for over six months, highlighting the value of guided fitness programs over simple facility access.
| Metric | Value | Source |
|---|---|---|
| Total U.S. Gym Members (2024) | 77 Million | HFA 2025 Consumer Report |
| U.S. Population Penetration | 24.9% | HFA 2025 Consumer Report |
| Members Using Personal Training | 22.6% | HFA 2025 Consumer Report |
| Members Using Small-Group Training | 32.3% | HFA 2025 Consumer Report |
| New Members Who Quit in 6 Months | 50% | HFA/IHRSA Benchmark |
| Avg. Monthly Membership Fee | $69 | HFA 2025 Consumer Report |
| Avg. Annual Sessions (2019 vs. 2024) | 28 vs. 21 | HFA 2025 Consumer Report |
6. The Weight Loss Industry by the Numbers
The U.S. weight loss market is projected to hit a $135 billion peak in 2025, according to Marketdata LLC. However, this massive industry is undergoing a structural shift. The rise of medical weight loss, including GLP-1 drugs, is causing a contraction in commercial diet programs. In contrast, the service-oriented personal training industry continues to grow, with a projected market size of $11.9 billion in the U.S. for 2026.
| Metric | Value | Source |
|---|---|---|
| U.S. Weight Loss Market (2025) | $135 Billion | Marketdata LLC, March 2026 |
| U.S. Personal Trainer Market (2026) | $11.9 Billion | IBISWorld, July 2025 |
| Global Personal Trainer Market | $15.6B (2025) → $43.3B (2036) | Future Market Insights, 2026 |
| Global Weight Management Market | $176.67 Billion (2025) | Grand View Research, 2025 |
| U.S. Weight Loss Services CAGR | -5.5% | IBISWorld, July 2025 |
This data shows a clear trend: consumers are moving away from DIY diets and toward expert-led fitness programs and medical solutions.
7. GLP-1 Medications & The Fitness Response
The introduction of GLP-1 agonists has coincided with the first measured drop in self-reported obesity rates in years, from a 39.9% peak in 2022 to 37.0% in 2025 (Gallup). While these drugs are effective for weight reduction, they can also cause significant loss of fat-free mass. This makes resistance training a critical component to preserve muscle and metabolic function, positioning personal trainers as essential partners in a medical weight loss journey, not obsolete competitors.
| Metric | Value | Source |
|---|---|---|
| Adult Obesity Rate (Self-Reported) | 37.0% (2025) vs. 39.9% (2022) | Gallup, Oct 2025 |
| U.S. Adults Who Have Used GLP-1s | ~1 in 8 | KFF Health Tracking Poll, May 2024 |
| Lean Mass Loss w/o RT on GLP-1s | Up to 39% of total weight lost | Frontiers in CDH, 2025 |
| Weight Loss in STEP 1 Trial | ~15% over 68 weeks | NEJM, 2021 |
| GLP-1 Users Who Exercise More | 13% | Reach3, 2024 |
| New Gym Revenue from GLP-1 Users | $6.8 Billion Opportunity | Reach3, 2024 |
Pairing medical treatments with expert fitness guidance is key. Services like HSA/FSA-eligible personal training can make this integrated approach more accessible.
Weight Loss Statistics by the Numbers: Summary
| Metric | Value | Source |
|---|---|---|
| U.S. Adult Obesity Rate (Measured) | 40.3% | NCHS/NHANES, 2026 |
| U.S. Adults Overweight or Obese | 72.4% | NCHS/NHANES, 2026 |
| Adults Meeting Both Activity Guidelines | 24.2% | CDC NCHS, 2020 |
| Supervised Training Adherence | 88.2% | JSCR, 2025 |
| Self-Guided Training Adherence | 52.2% | JSCR, 2025 |
| Total U.S. Gym Members | 77 Million | HFA, 2025 |
| New Gym Members Quitting in 6 Months | 50% | HFA/IHRSA Benchmark |
| U.S. Weight Loss Market Size | $135 Billion | Marketdata LLC, 2026 |
| U.S. Personal Trainer Market Size | $11.9 Billion | IBISWorld, 2025 |
| Adults Who Have Used GLP-1s | ~1 in 8 | KFF, 2024 |
| Fat Reduction in PT-led Group | -1.61 kg (p=0.033) | ScienceDirect, 2024 |
| FFM Change with Diet + RT | +0.3 kg | BMJ Open Sport & Ex Med, 2025 |
| FFM Change with Diet Only | -0.8 kg | BMJ Open Sport & Ex Med, 2025 |
| Self-Reported Obesity Rate (2025) | 37.0% | Gallup, 2025 |
| Gym Members Using a PT | 22.6% | HFA, 2025 |
Methodology and Sources
This report compiles data from Tier 1 and Tier 2 sources, prioritizing government health statistics, industry-leading market research firms, and peer-reviewed scientific journals.
- Centers for Disease Control and Prevention, National Center for Health Statistics (CDC/NCHS), National Health and Nutrition Examination Survey (NHANES) & Physical Activity Reports, 2020–2026
- Gallup, Health and Healthcare Poll, 2025
- Health & Fitness Association (HFA), 2025 U.S. Consumer Report
- IBISWorld, Personal Trainers in the US Industry Reports, 2025
- Marketdata LLC, The U.S. Weight Loss & Diet Control Market, 2026
- Journal of Strength and Conditioning Research (JSCR), Gavanda et al., 2025
- Frontiers in Clinical Diabetes and Healthcare / Frontiers in Endocrinology, Peer-Reviewed Studies, 2025-2026
- BMJ Open Sport & Exercise Medicine, Peer-Reviewed Meta-Analysis, 2025
- Kaiser Family Foundation (KFF), Health Tracking Poll, 2024
Note: The statistic that 24.2% of adults meet both aerobic and strength guidelines is from 2020 NHANES data, which is the most recent available data for this specific combined metric as of our publication date.
Last updated: April 2026.
We update this page quarterly.